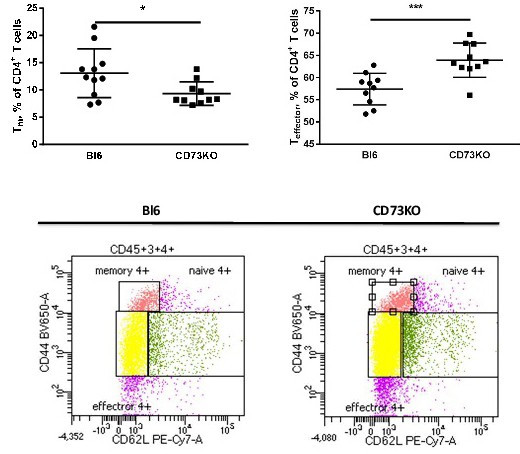
Fig. 3. Influence of CD73-deficience on the different subpopulations of CD4+ T cells in spleens of Bl6 and CD73KO mice. Data are presented as a scatter-plot with mean and SD and analyzed with the unpaired T test (* p<0.05 and *** p<0.005) - upper panel. Bottom panel - representative FACS pictures from Bl6 vs. CD73KO mice.